Using the WebAssembly C# Debugger
There are two ways to debug a WebAssembly application:
- Using Visual Studio integrated debugger (preferred)
- Using the browser's debugger
Using Visual Studio
Here's what you need to do to debug an Uno Platform application in Visual Studio (2022 17.3+ or later):
Install the latest Uno Platform Visual Studio templates
Have Chrome or Edge (Chromium based)
In the NuGet Package Manager, update
Uno.Wasm.BootstrapandUno.Wasm.Bootstrap.DevServer8.0.0 or laterEnsure that
<MonoRuntimeDebuggerEnabled>true</MonoRuntimeDebuggerEnabled>is set in your csproj. It is automatically set when using the Uno.SDK.Ensure that in the
Properties/launchSettings.jsonfile, the following like below eachlaunchBrowserline:"inspectUri": "{wsProtocol}://{url.hostname}:{url.port}/_framework/debug/ws-proxy?browser={browserInspectUri}",
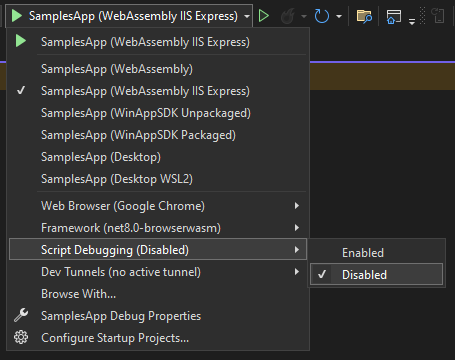
Then you can start debugging with the VS debugger toolbar:
- Select MyApp (WebAssembly IIS Express) or your application name as the debugging target
- Select Chrome or Microsoft Edge as the Web Browser
- Press F5 or Debug > Start Debugging
You should now be able to set breakpoints or do step-by-step debugging of your code.
Tips for debugging in visual studio
- Some debugger features may not have yet been implemented by the .NET and Visual Studio team. You can take a look at the dotnet/runtime repository for more details.
- If the breaking does not hit, make sure that the
inspectUrilines have been added to theProperties/launchSettings.jsonfile. - Methods with only invocations to generated code (e.g. control constructors with only "InitializeComponent" in it) may not allow placing breakpoints. Add some explicit code in the scope to place breakpoints.
Using the browser debugger
To debug your application:
Make the
net10.0-browserwasmactive debugging target framework (right-click set as startup in Solution Explorer)Ensure that
<MonoRuntimeDebuggerEnabled>true</MonoRuntimeDebuggerEnabled>is set in your csproj. It is automatically set when using the Uno.SDK.In the debugging toolbar:
- Select MyApp (WebAssembly IIS Express) as the debugging target
- Select Chrome or Microsoft Edge as the Web Browser
- Make sure script debugging is disabled
Start the debugging session using CtrlF5 or Debug > Start Without Debugging from the menu, (F5 will work, but the debugging experience won't be in Visual Studio)
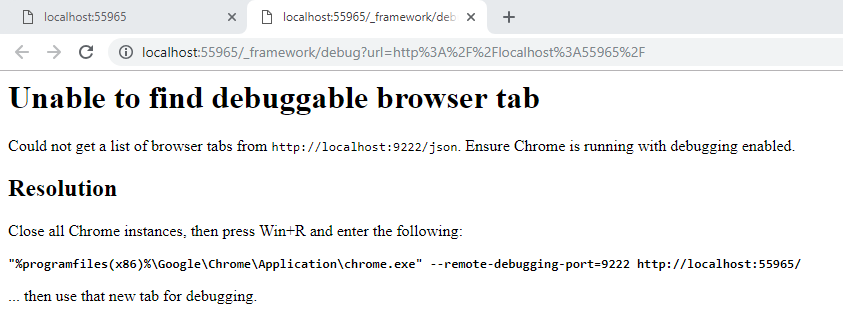
Once your application has started, press AltShiftD (in Chrome, on your application's tab)
A new tab will open with the debugger or instructions to activate it
You will now get the Chrome DevTools to open listing all the .NET loaded assemblies on the Sources tab:
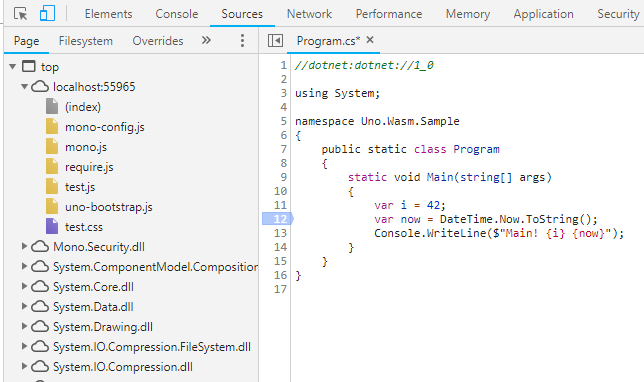
You may need to refresh the original tab if you want to debug the entry point (Main) of your application.
Tips for debugging in Chrome
- You need to launch a new instance of Chrome with right parameters. If Chrome is your main browser and you don't want to restart it, install another version of Chrome (Chrome Side-by-Side). You may simply install Chrome Beta or Chrome Canary and use them instead.
- Sometimes, you may have a problem removing a breakpoint from code (it's crashing the debugger). You can remove them in the Breakpoints list instead.
- Once IIS Express is launched, no need to press CtrlF5 again: you simply need to rebuild your WASM head and refresh it in the browser.
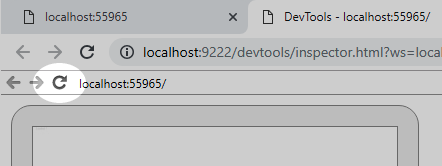
- To refresh an app, you should use the debugger tab and press the refresh button in the content.
- If you have multiple monitors, you can detach the debugger tab and put it on another window.
- For breakpoints to work properly, you should not open the debugger tools (F12) in the app's tab.
- If you are debugging a library which is publishing SourceLinks, you must disable it or you'll always see the SourceLink code in the debugger. SourceLink should be activated only on Release build.
- When debugging in Chrome, Ctrl+O brings up a file-search field. That way it's a lot easier to find .cs files versus searching through the whole folder hierarchy.